
While perhaps less glam than the next Hollywood film (especially when we get to go to cinemas again) this latest update is at least as exciting (honest!)

Flag icons are from FontAwesome , and are CC licensed
The last couple of months have seen an overhaul of our Actions-interactions. Until now it has only been possible to add Actions (and Notes) at the bottom of each page, showing the history in an 'infinity wall' beneath; or via the trusty Actions management page (linked in the top navigation). We know the previous Actions experience meant that navigating to the relevant insight was more complicated than it should have been and as a result, important charts or previously raised actions containing pertinent information were easily missed. This upcoming feature update aims to give you further functionality and power when raising or reviewing actions whilst also streamlining the experience to help you work more efficiently. These changes, detailed further below, will be released in the coming weeks.
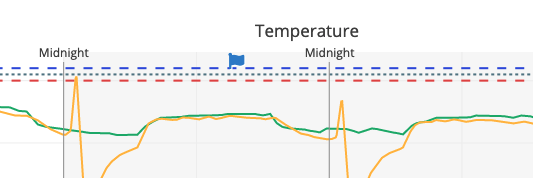
As I hinted at above, we’re pleased to introduce an Action Timeline to the top of pages where Actions can be raised. This gives a quick overview of how many and what the status of the Actions are, over time. You can click on the flags to bring up the conversation to catch up with progress, re-assign the task, or reply to it. You’ll also see the history of a particular Action (replies, status changes, re-assignments) on the Action page itself, along with the chart from which the Action was raised.
The Action Timeline gives a high level overview of progress for those on your team who need to check-in and gather a quick lay of the land. For those of you used to adding and updating actions, we’ve also made improvements to help your workflow. Here’s the detail...
- You can now add Actions directly onto charts where the data you want to draw attention to is showing. Look for the
 icon on the left hand side of the chart.
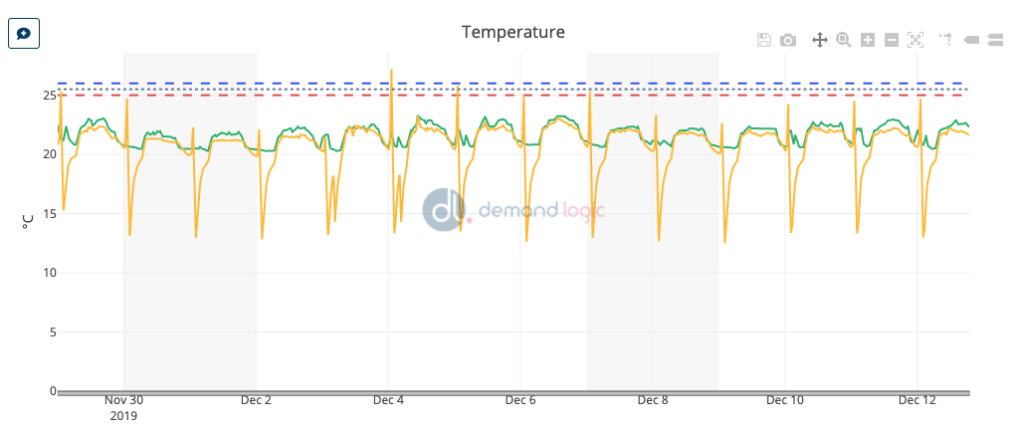
- Actions added will also show on the chart where they were added, so other members of your team can easily see when an Action has been identified, and the current status of that Action.
- Actions that are made on charts will show that chart on the Action page itself, so that replies can be made there and then, without having to navigate to the original page to see what was being mentioned.
- As described above, we’ve added an Actions Timeline to give an overview of Actions’ statuses. Click on a flag to see the conversation.

Flag icons are from FontAwesome , and are CC licensed
- We've changed our Action iconography to be more consistent, and to allow greater flexibility in using the Action markers throughout the DL platform - all Action statuses are now coloured flags, and Notes are a pink sticky-note icon.

Flag icons are from FontAwesome , and are CC licensed
- You can now draft an Action, while still navigating the data on a page.
- Clicking on an Action flag in the charts or Action Timeline brings up the whole conversation and allows you to reply or change the status and owner directly.
- The date range that the chart is showing is automatically attached to a new Action made from the charts.
We really hope you like the improved Actions interactivity, and that it will streamline the use of Actions to get problems solved, and your properties more comfortable, more energy efficient and better maintained - let us know what you think!
-Steve


