
Hello! We've got some exciting news...

Back in June we launched our virtual metering tools that help you visualise how much demand a plant item is placing on your services, and better identify plant that is misbehaving and monitor improvement over time. You will likely have noticed the new tab appear on asset pages, which show how much energy that asset has consumed - half-hourly, daily and monthly for as long as we have been gathering data from your site.

Metering updated
We have since made a big push to improve the other part of the metering experience - that of physical meters attached to gas, electricity or potable water supplies and subsystems.
Previously, we collected meter data into visualisations that showed the rate and profile of the meter over a short period of time, and these served well but wouldn't show a longer period, nor were they linked up to the other assets in our internal model of your buildings.
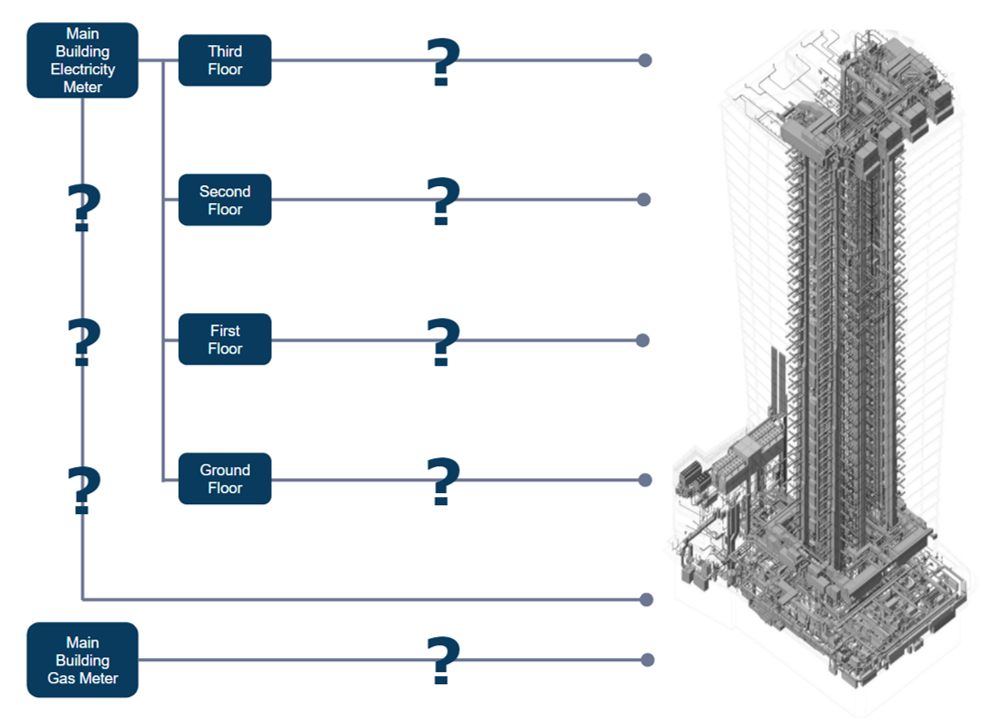
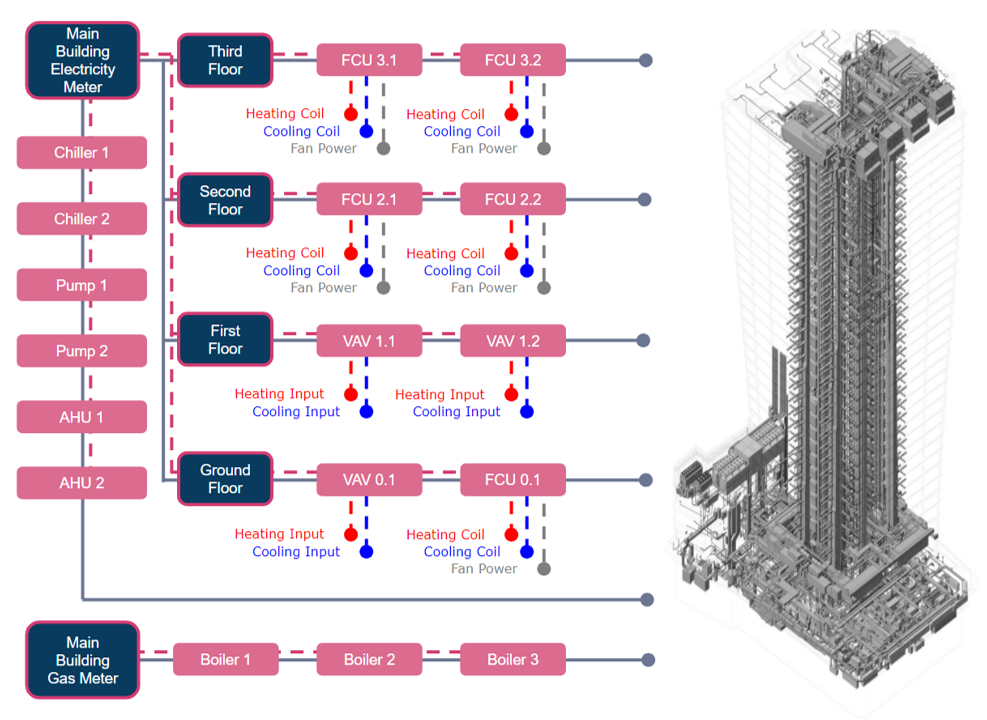
With our recent changes, we are able to represent your meters associated with particular systems or subsystems; those systems being associated with plant that depend on them for power, gas or water. This combination of physical and virtual metering gives our platform the ability to compare and expose further insight into the performance of your buildings, to help isolate energy wastage and mitigate it.
As with the virtual metering introduced in summer, our new metering experience gives you live half-hourly charts, as well as daily consumption and monthly consumption for as long as we have been collecting your data. This means you can more easily see over time how much energy your interventions and actions have saved, and spot when systems revert, start malfunctioning or are misconfigured.
You can find your meters in the same place as before, look for "Meters" in the top navigation.
Submetering
With a little more information, we can associate meters and submeters, so that you can get directly from a main system to those it supplies. You'll see the submeter data on the same page as the main meter data (i.e. that of the system it is metering, e.g. Main Electricity Supply). You can quickly access those submeters by clicking "Show legend and details" below the submeter chart, and then clicking on the submeter you want to see.

This is a first step on the path to making your meters even more explorable.
New visualisations
As an exciting addition to this work, we've been working hard to update and improve how you can explore your data over time. This month, we launched an incredibly useful visualisation - the picture this gives of your data truly is worth a thousand (or, millions of)... data points! We pleased to introduce you to consumption heatmaps!
You'll find these on any asset that shows its "input energy" - that could be from a virtual meter or a physical meter attached to gas, electricity or potable water supply or subsystem. Here's a quick tour...
Daily 'half-hour' heatmaps
These day-per-row visualisations allow you to pan back and forward in time over half-hourly data, showing up to a year at a time. The colour scale on the right shows consumption for that period, with colouring relative to the values in that period - red means more consumption, green is less, and white is relatively negligible.
These are available for any physically metered supply (electricity, gas, cold water) that has a data stream we're reading from your BMS (which might include a meter directly on a boiler's gas inlet, for example).
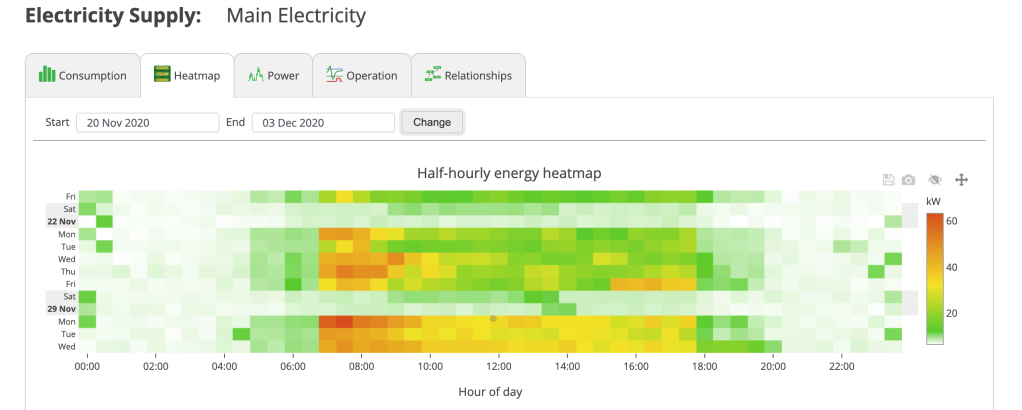
Clicking the disk icon at the top-right will download this data in a CSV file with the same layout as the chart (i.e. 48 columns of half-hour data, with a day per row).
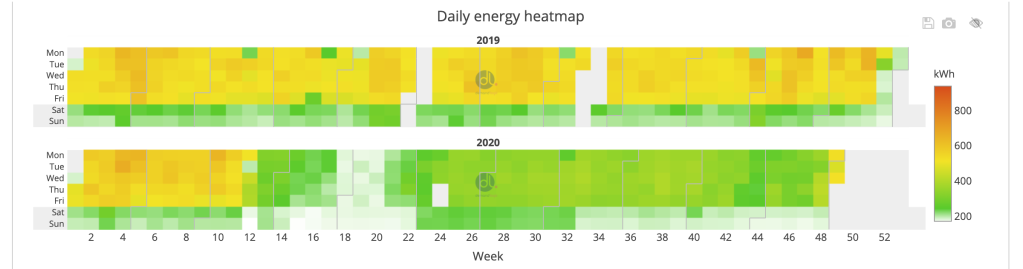
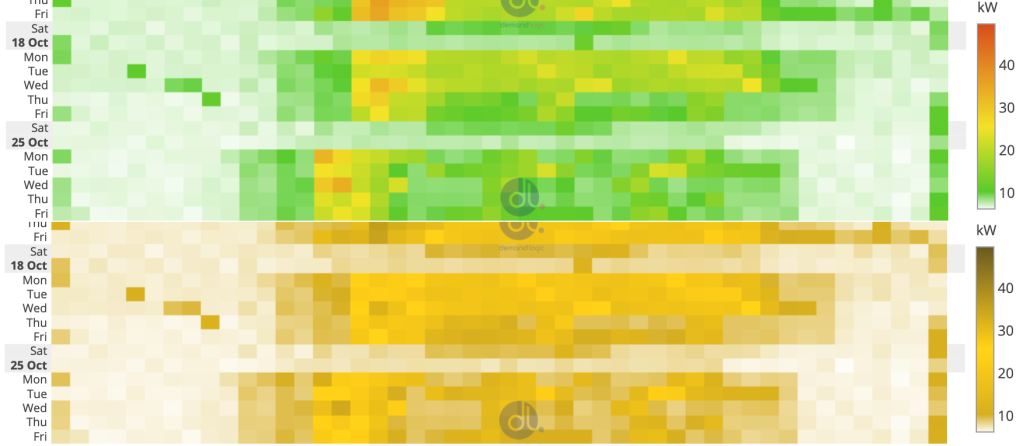
Annual 'daily' heatmaps
For both physical and virtual meters, we also provide a long-term view of the consumption per day. In this visualisation, each block is a year, split horizontally into weeks (and so, months) and vertically by week-day (so all Mondays are on the first row for a year block). Again, the colouring is relative to the entire data that is visible; and the data is available for as long as we have been monitoring your building. You can currently only (!) view the last 10 years' worth.
Accessibility
Additionally, we've had feedback that our colour scheme was not accessible to people suffering from forms of colour-blindness. Colour blindness affects 8% of men (and 0.5% of women) and our user base is largely male - this was having some serious impacts on many of our users' ability to make sense of charts.
In this visualisation, it is particularly challenging - below is the same data rendered for with and without a colour-blindness (protanopia) filter applied:
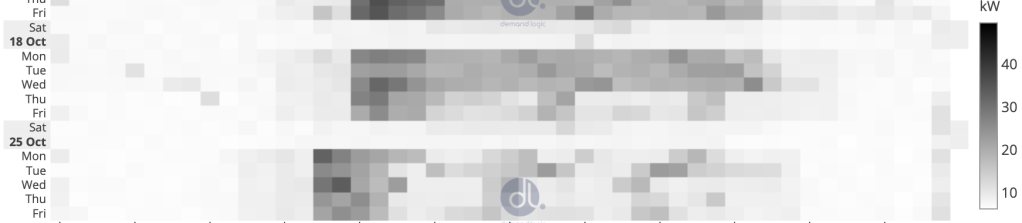
To help mitigate for this, this visualisation has a high-contrast mode filter - look for the eye icon in the top right:
![]()
With this turned on, the heatmap will instead look like this, which we hope is an improvement to those affected by this condition. Please let us know what you think!
Let us know what you think!
As ever, we love to hear what you think of our new and updated features, and we really take your opinions and requests into account as we develop the platform. Please leave a comment below or chat with your Technical Account Manager to give us feedback
-Steve

