Nature has been slowing down as we descend into winter, however at Demand Logic we have been all about speeding things up over our last 3 sprints (since the beginning of November). In my last post, I mentioned that often much that goes on behind the scenes which isn't always visible on the Platform itself. The work over the last 2 months has been of this nature - much change behind the curtain with little visible difference up front; however as of the new year (and for those of you keen enough to be visiting the platform in late December) you should see that many of our views that rely on large amounts of data become noticeably faster - the Rogue Finder, Major Plant Watchdog, and any Asset page with many charts. And we have a new addition... read on for more!
So what's been going on?
Well, we have slimmed down the amount of data being sent to your browser, which means that both the preparation and sending of it are faster; this will mean that the mobile experience is improved too. We have also taken the opportunity to build on our souped-up data caching (which I mentioned in the previous post) to make sure that by the time you hit the Rogue Finder all data is there ready and waiting.
You may also notice that the columns in the Rogue Finder have changed subtly; this reflects a clarification of language and calculations behind what was previously called "Hunting". The intent of "Hunting" was to show "a measure of how much the temperature fluctuates." -- although this is what it showed, we found that the term "Hunting" itself had other meanings to some people, which could cause confusion.
Now, we have moved this calculation into a direct property of a Terminal Unit Asset called "Temperature Movement", whose result is defined by this question:
"On average over the last hour, how rapidly was the Control Temperature moving?".
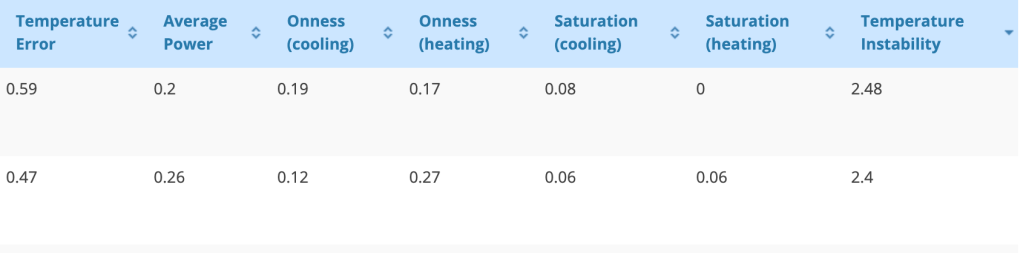
The fact it is now a direct property of a Terminal Unit means that we can also easily reuse this calculation elsewhere and you can see it at any time on the Asset itself, not just on the Rogue Finder results. We hope that this clarification of language makes this value more honest and meaningful to users of the Rogue Finder.
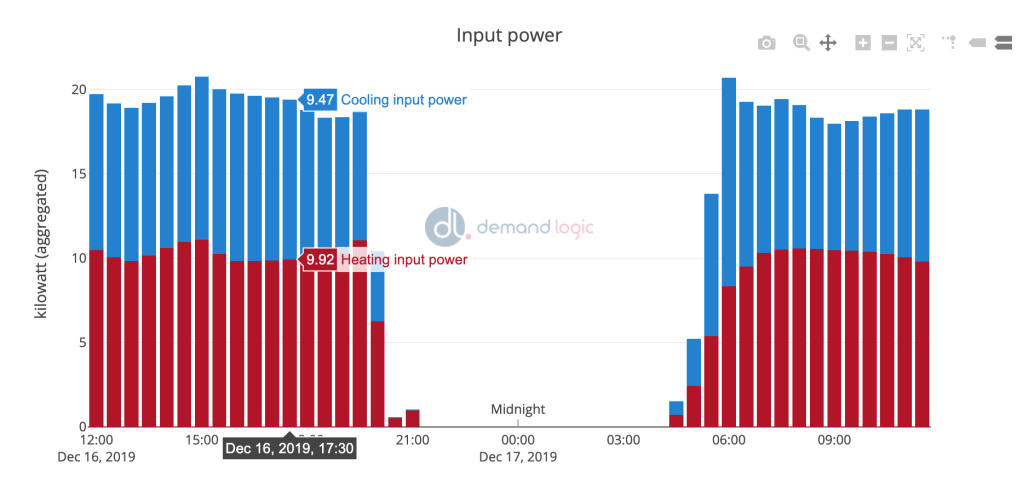
We have also introduced a new feature in the shape of a Collection page. This new page will allow detailed overviews of groups of Assets, taking advantage of our Building Services Model -- the properties of Assets, and their relationships to each other -- to display combined charts. This page largely replaces and enhances the functionality that has been available through Lab Views in the past, but they render fast and have the interactivity of the present Asset page charts -- you can scroll around and zoom in and out without having to wait a long time for a reload.
Keep an eye out for charts that are split out by Floor and combined Heating and Cooling Power charts, which together are powerful for identifying your biggest problem areas.
Further behind the scenes, we've added to our onboarding tooling so that site-setup is even more efficient for our team than it was before, and new customers or customers with new Properties coming online should feel the trickle-down of that efficiency boost too.
I'm looking forward to taking the learning and new technology gained through these last 2 months forward into 2020, to bring yet more improvements and new features.