There can be many reasons why a building’s plant is running outside of expected hours however, before being able to address these issues, those responsible for their resolution need to be able to identify and understand the extent of each problem. Large plant items supply vast networks of smaller assets which can result in complex demands that are relentlessly dynamic. By example, the environment in the 34-storey Walkie-Talkie tower is controlled by 1,200 air conditioning units, with over 180,000 data points generating 17 million data values on building performance each day. At this scale, human beings cannot be expected to see, let alone track, the level of detail required to stay on top of all changes constantly happening throughout their buildings.

Demand Logic’s approach is to start broad, delivering simple overviews that visualise the performance of many assets over extended periods. The key design of these features is that any unexpected operation, no matter how insignificant it may seem on the surface, is easily identified by any user, regardless of their technical or industry background. Once a potential problem is identified, users are only one click away from a more detailed view of the recognised issue. Again, this ‘diving down’ process can be continued until the most granular insight of an individual asset’s performance is reached - the raw BMS data points. This functionality enables Demand Logic’s users to find the needles in their haystacks and a starting point in this process is the ‘Building Performance Overview’.
1. Building Performance Overview
The Building Performance Overview (BPO) presents a visual summary of a building’s thermal comfort, terminal unit performance and plant asset operation - for this article we will focus on the latter. In this view, plant items are grouped into collections so that any trends between related equipment operation are more easily identified. Each cell contains a single-days worth of operational data with up to 365 days worth of information viewable at a time, again allowing for any particular operational trends to be recognised.
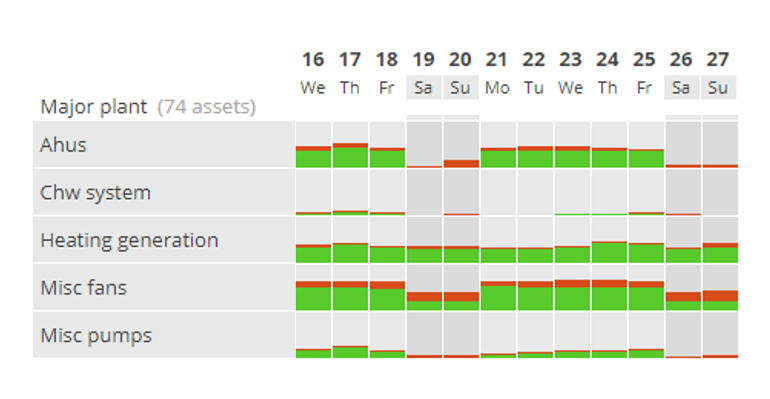
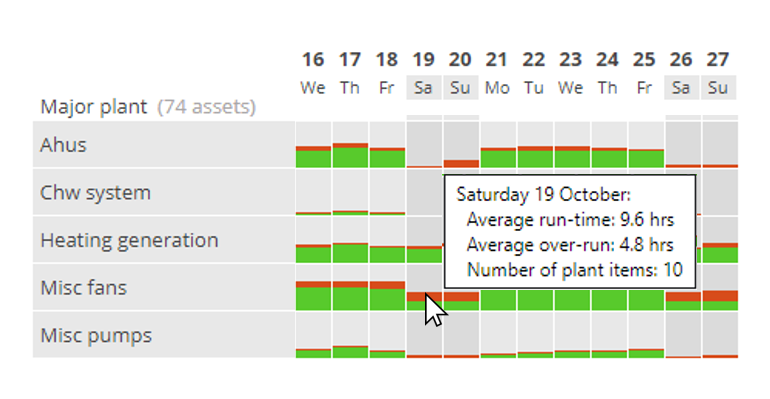
In each cell, there is a clear distinction between expected (green) and unexpected (red) operation. If none of the assets in a collection operated on a specific day, then the cell would remain fully grey. When a user hovers over a specific cell, a pop-up box provides further details about the data behind the visualisation. This combination of simple visual markers and concise detail helps to direct the focus of the user to the problematic plant items. Clicking a single cell will open up a single day view of the selected plant collection where the operation of individual plant assets can be investigated further.
Looking at the above BPO, we can see the regular unexpected operation of assets in the ‘fans’ collection. Hovering over the cells as shown below confirms unexpected operation on both weekdays and weekends. The suggested next step for a user identifying this issue would be to click on a single ‘fans’ cell to open up the relevant Major Plant Watchdog (MPW).
2. Major Plant Watchdog
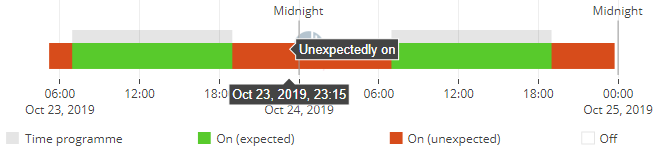
The Major Plant Watchdog (MPW) is a more detailed view outlining the operation of a single plant collection - in this instance, ‘fans’. Each MPW visualises whether Demand Logic ascertains a plant item to be in operation, and uses the predetermined calendars/time schedules associated with each asset to determine if the detected operation is expected or not. In the above screenshot, the grey bars indicate the time schedules of the major plant items, the green bars indicate plant operation that occurs during the associated time schedule whilst the red bars indicate operation that occurs outside of time schedules. This enables the user to identify which plant items are operating out of hours and raise subsequent actions required to remedy this. Clicking each asset’s name will open an individual asset view where causes of unexpected performance can be investigated further. This view can also be expanded from the default 24hrs to span up to 14 days of data, allowing the user to see any patterns of operation that may need attention. Additionally, the charts are interactive and can be dragged horizontally to increase or decrease the range being viewed.
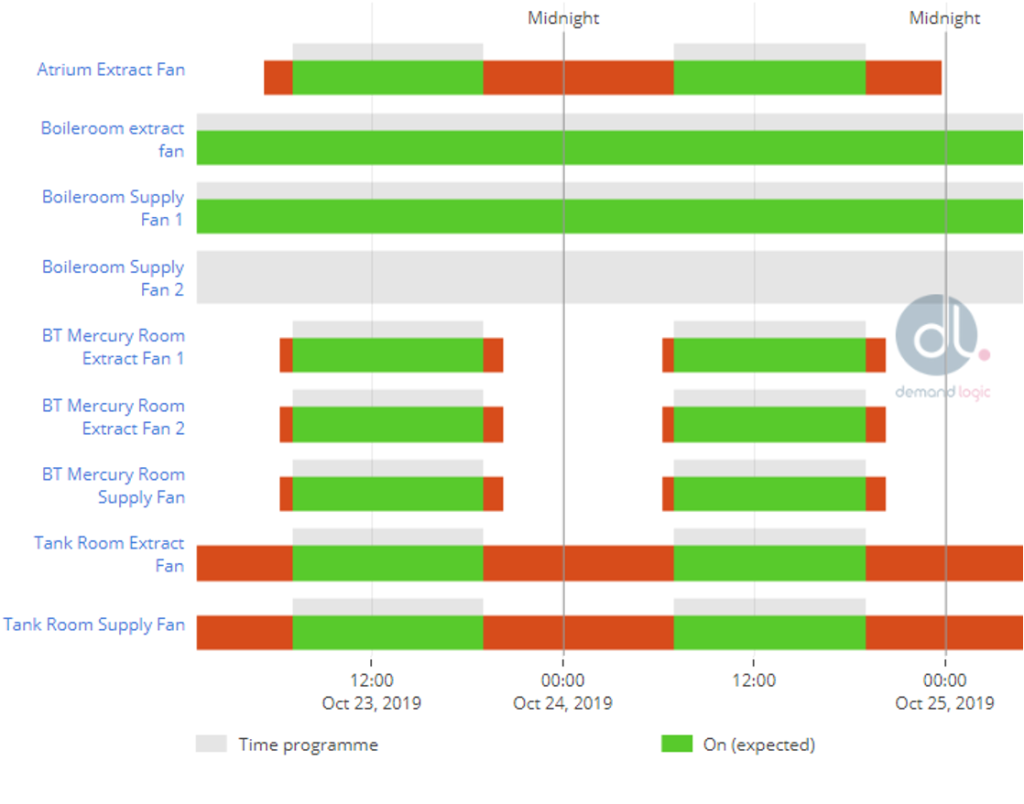
The above screenshot demonstrates several issues worthy of further investigation. Firstly, the data associated with Tank Room Extract and Supply fans suggest that they are operating continuously despite their expected run time being between 0700-1900 Monday - Friday. Additionally, it appears that the Atrium extract fan is also operating at unexpected hours. Clicking on ‘Atrium Extract Fan’ will enable the user to view the individual asset in more detail.
3. Individual Asset Views
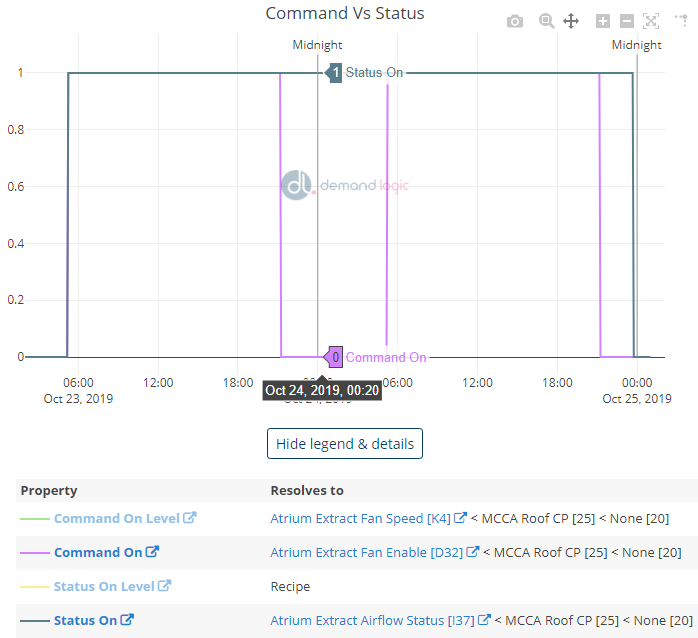
The individual asset view contains several charts outlining the properties associated with the performance of an asset. The charts included can vary depending on which asset type is being viewed and what raw data is available. Additionally, if a specific data point is not available on the BMS, such as output power, Demand Logic can use suitable assumptions and ‘recipes’ to estimate values for these properties. The enabled chart above confirms this asset’s unexpected operation during the selected period. Looking at the Command Vs Status chart for the Atrium Extract Fan below, there is a clear mismatch between the enable command from the BMS and the airflow status of the fan, possibly caused by a manual override bypassing the BMS output.
4. BEMS Investigation
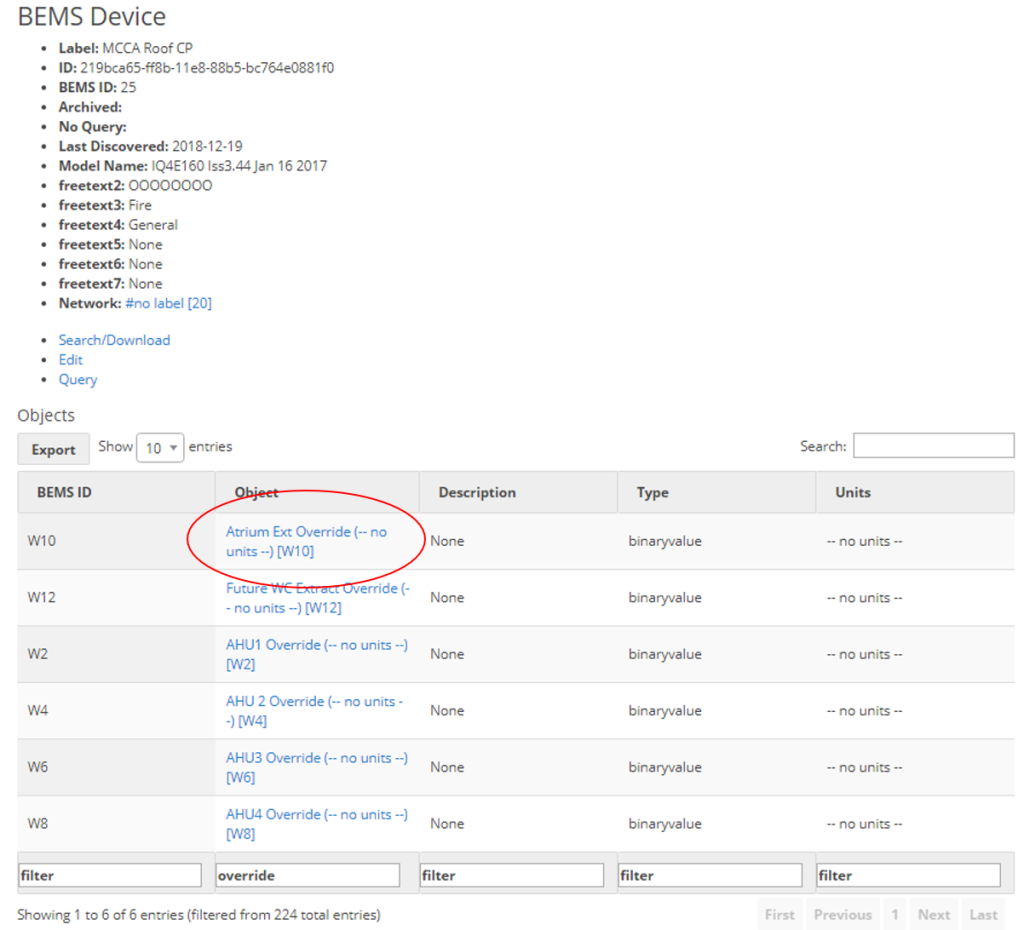
The 'Command Vs Status' legend above reveals further details of the specific Building Energy Management System (BEMS) objects behind each chart and associated properties. Following the 'Resolved to' links directs users to the raw BEMS data and enables investigation of other available points on the same BEMS device. The BEMS device view is easily filtered and sorted - a search for 'Override' reveals an 'Atrium Ext Override' point that may be responsible for the unexpected operation identified above.
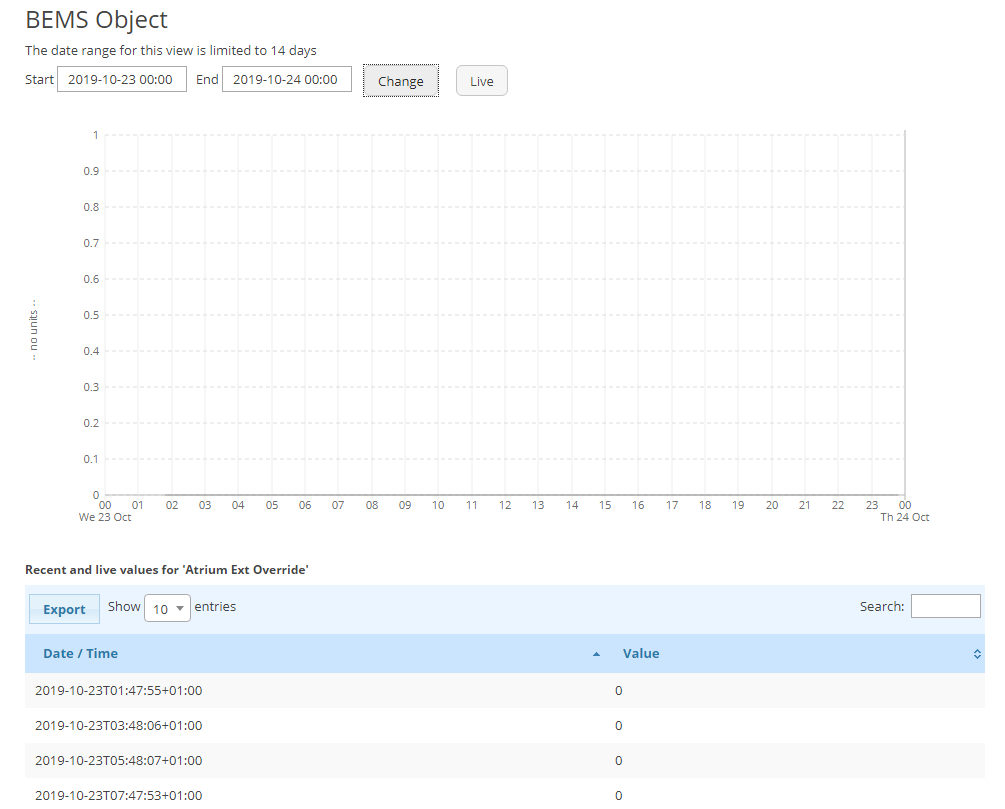
Further investigation of this 'Atrium Ext Override' reveals a binaryvalue of 0 confirming that the unexpected operation is not caused by an override in the control software. This suggests that a physical override switch (not visible on the BMS) may be responsible for the unexpected operation identified at the beginning of the 'dive-down'.
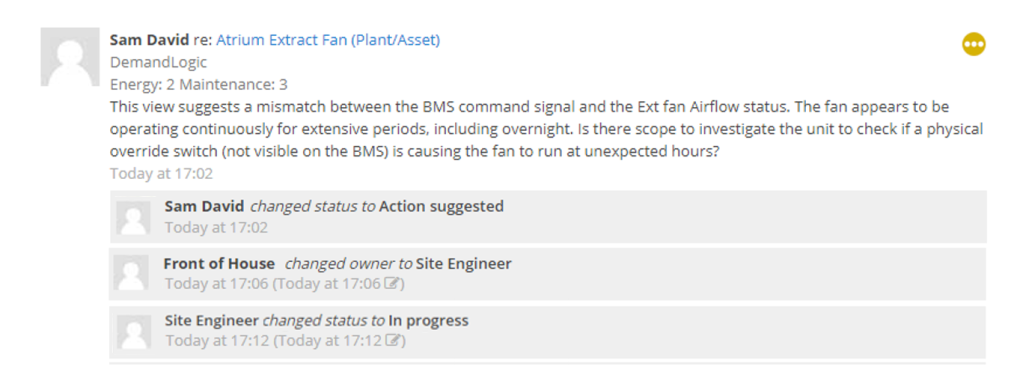
Now a potential cause of the issue has been identified, the platform user can raise an action against this specific individual asset view, sharing the knowledge uncovered with all those involved in managing this property. This action can then be assigned to the appropriate user for their attention and actions can be fixed to a specific date range ensuring the relevant data and visualisations are easily accessible by those best suited to resolve the issue.
Demand Logic is a collaborative tool, designed to bring together multi-disciplined teams and enable them to improve the performance of their buildings together. We recognise the importance of making our data and analysis accessible to all users, regardless of their technical background. An accurate representation of property performance must be available at varying depths of detail, complementing the rich variety of skills and disciplines involved in property maintenance. Without Demand Logic equipping users with the right triage-tools for the job, it is impossible to know just how many examples of unnecessary operation are crippling the performance of commercial buildings. This article demonstrates how a single physical override signal not visible on the BMS can remain undetected, thus causing the continuous operation of a larger plant item. Commercial buildings are driven by thousands of configurations similar to the above and the potential for poor performance to slip by unnoticed is too big to ignore. Whilst this article focuses on the identification and investigation of unexpected plant operation, there are several other areas of poor property performance that Demand Logic measures and evaluates.
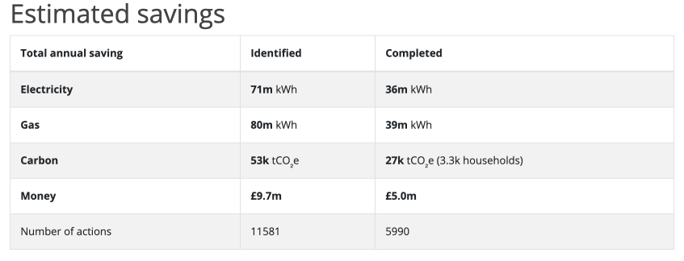
Please keep an eye out for future articles outlining the importance of monitoring environmental conditions, utilising terminal setpoint achievement to drive condition-based maintenance and how Demand Logic continues to simplify these processes for our customers. At Demand Logic we have supported the reduction of 27k tCO2e - equivalent to over 3,000 households worth of Carbon emissions. We have also identified a further 26k tCO2e. A lot of these identified actions require simple resolutions; the difficulty is in identifying them. If you are interested in transforming the way your buildings are managed please drop us a message here.